Radio Amateur Report: House Mains Analysis
The following page is the opinion of the Radio Amateur who carried out the tests.
PLT and mains wiring
The degree to which PLT has been observed radiating varies considerably from property to property. To find the reason we need to look at the network infrastructure used by PLT: the house mains.
Although a sweeping generalisation, it would be fair to say that most properties have been wired or rewired in the last 30 years and are thus likely wired to a recent edition of BS 7671, 15/16/17th edition. So far we have not seen any analysis of European wiring however it is important to stress that although the UK wiring regulations have been undergoing a process of alignment with the European CENELEC Standards, the UK does possess one unique feature which quite possibly make PLT emissions in the UK somewhat different to that found in mainland Europe - or indeed most of the rest of the world.
Following the Second World War, the rebuild process was hampered by a shortage of copper. To help facilitate the rebuild, the authorities made a change to the accepted wiring practice for the house mains sockets; they introduced the Ring Main (sometimes called Ring Final, 15th edition speak). By wiring the mains sockets with 2.5mm2 cooper twin & earth but rather than running a radial circuit (socket to socket like a chain, which has an end) the circuit was made into a loop so that the last socket in the 'chain' was connected back up to the distribution board (fuse board). This was the "Ring". It meant that a circuit capable of 20 amps was now capable of 30 amps (more actually but that was the fuse rating). This reduced the cost of the rebuild and also the demand for copper.
From a radio frequency energy perspective, "loops" have a different behaviour to "chains". The purpose of this article is not to engage in the engineering consequences too deeply but observe the net effect and see just how our UK wiring appears to a source of radio frequency energy. Below are some plots taken with a Network Analyser (a device which measures the various electrical characteristics of a 'circuit'). This can tell us much about the expected behaviour of energy which is put into that circuit (network).
Below is a series of plots of the house wiring at my home. It is wired strictly to BS7671:1997. I took numerous plots directly from several sockets around the house. Featured here are two rooms, a socket in the lounge and a socket in one of the bedrooms. The reason for taking multiple measurements is simple. To a source of energy being plugged into a socket, it sees a conductor and passes this energy to that conductor. In one room (lounge) the cables leave the socket vertically and enter the ceiling void where they bend 90 degrees and go in different directions, either to another socket or the distribution board. The socket in the bedroom has its cable leave vertically down for 30cm before bending 90 degrees and going horizontally in different directions. The length of cable prior to a bend, the distance between each socket, the amount which runs horizontally and which runs vertically all influence the radio frequency characteristics of the "circuit" which the source 'sees'. As you will see in the following traces, the effects are markedly different.
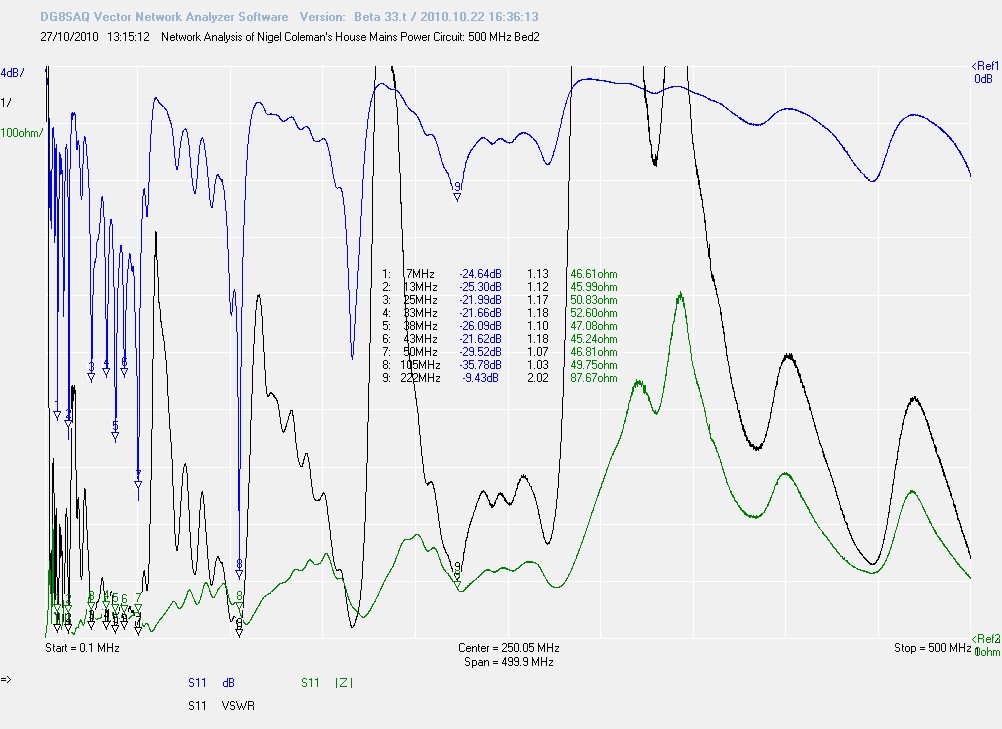
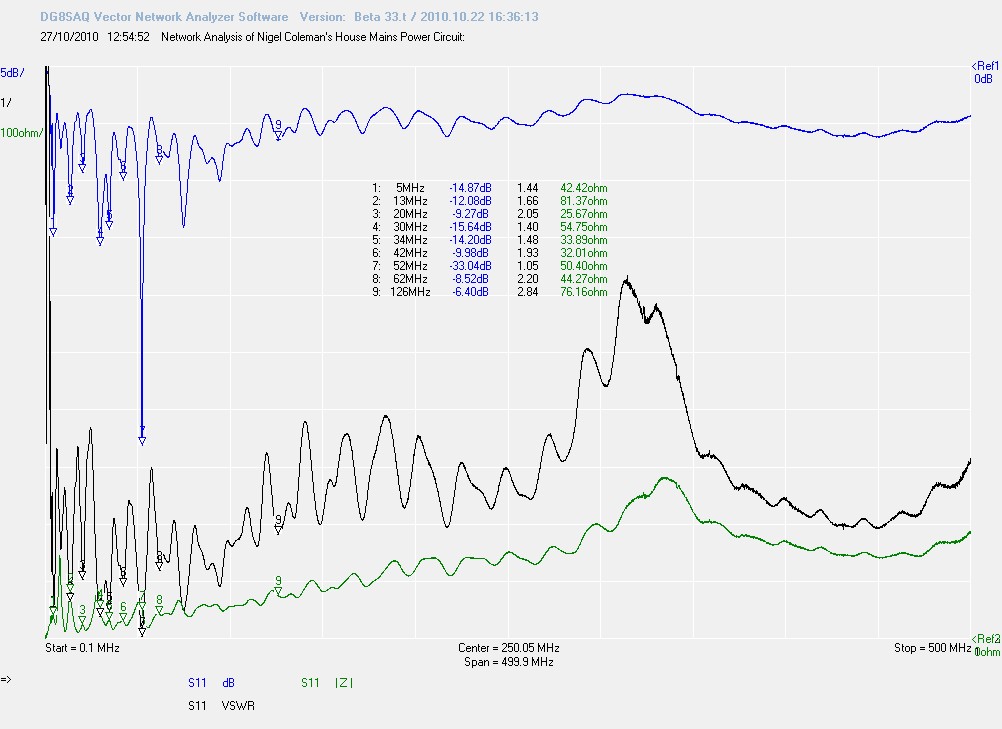
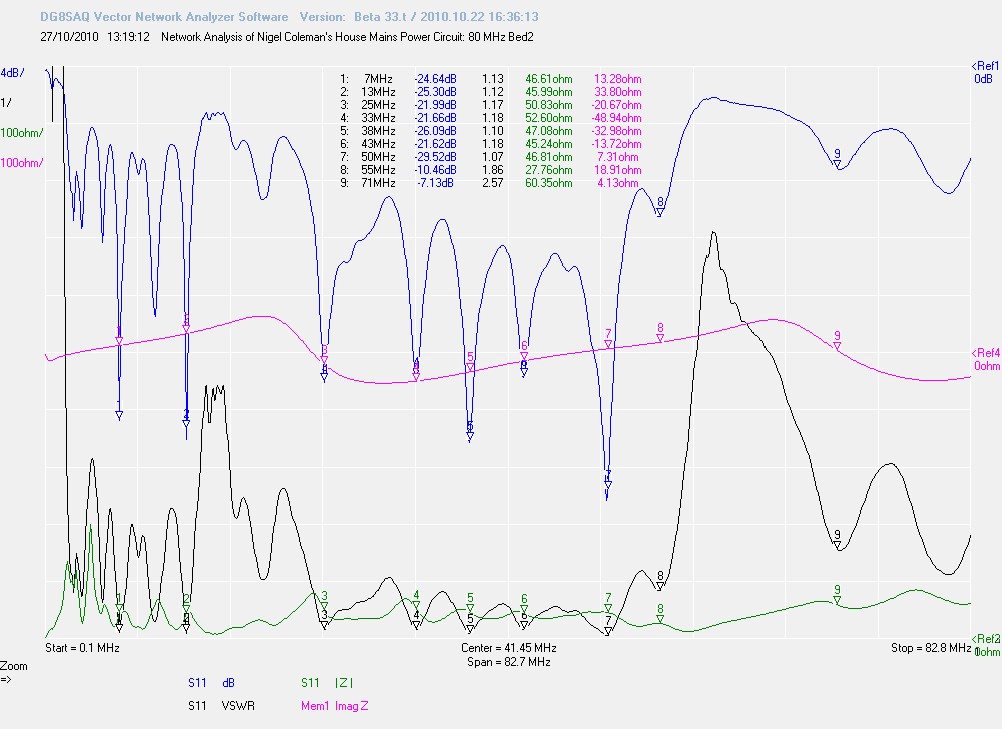
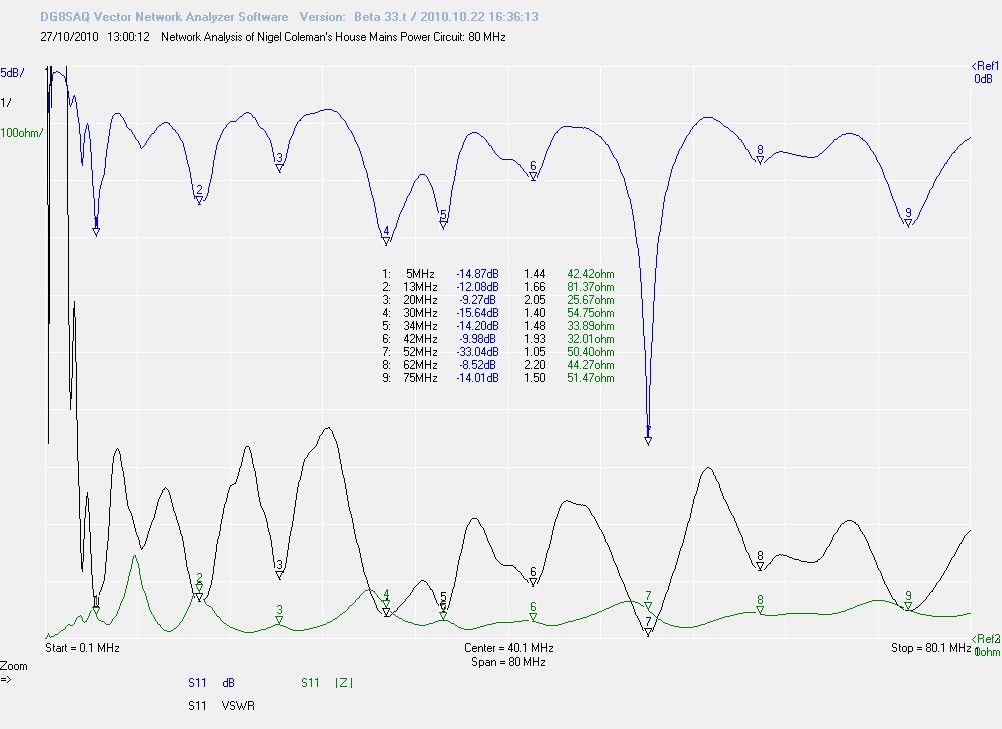
The result of these differences? Each adapter will be transmitting and receiving data and to do this it encodes the data to thousands of radio frequency signals which span large parts of the spectrum. On each unique frequency, the same physical 'circuit' will have different characteristics. So the amount of energy which ends up being radiated will vary according to frequency - and from house to house and socket to socket. Even plugging in your electric blanket will change this. Just think about laying on your nice cosy electric blanket with all that electrosmog firing through your body. Ugh. Back to the point. Below are six plots, three for each of the two sockets tested, sweeps of the characteristics at 500 MHz, 80 MHz (the new "limit") and of HF (shortwave). Each socket will have a pair of plots for each frequency. Still with me? Hope so. Each picture can be enlarged by clicking on it.
Bedroom 2, 500 MHz sweep.
Lounge, 500 MHz sweep.
Bedroom 2, 80 MHz sweep.
Lounge, 80 MHz sweep.
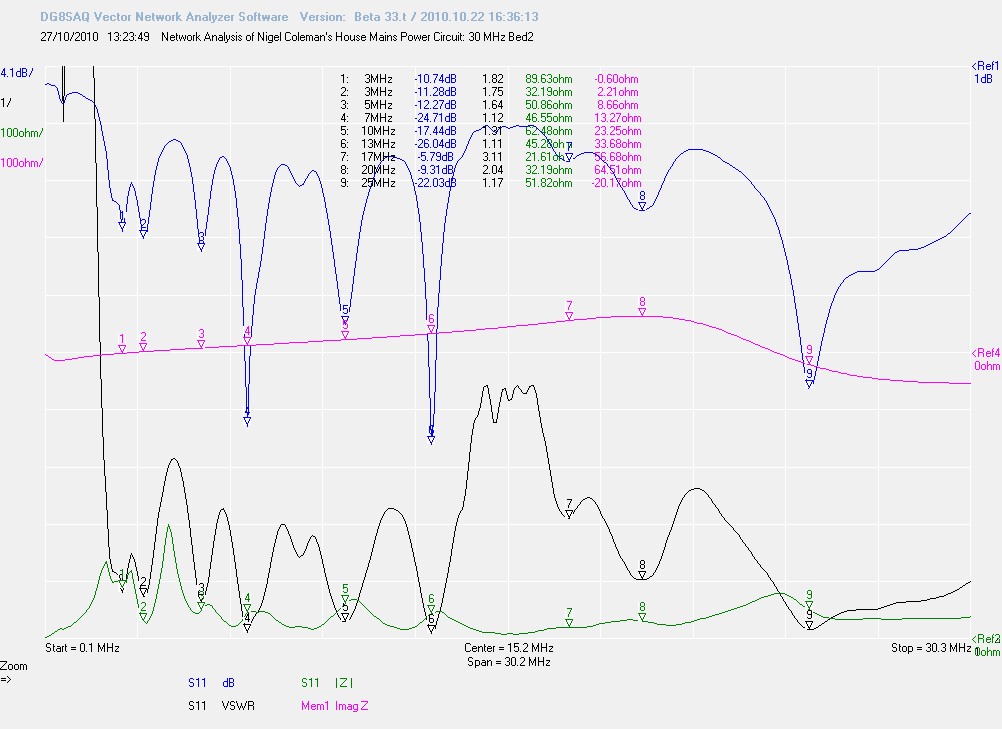
Bedroom 2, 30 MHz sweep.
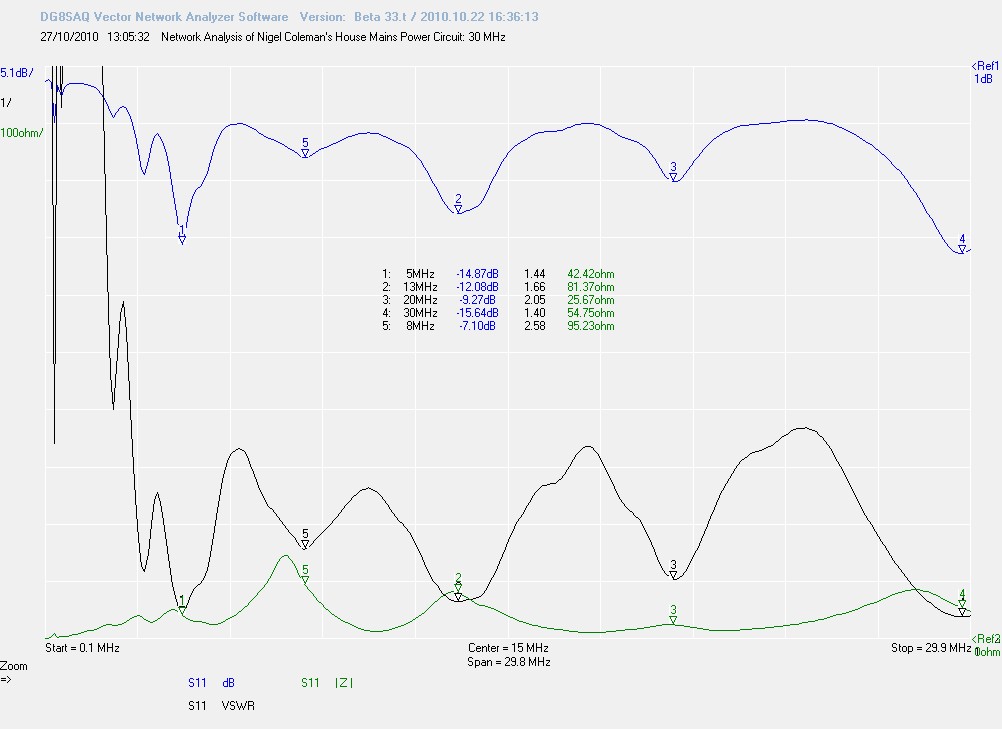
Lounge, 30 MHz sweep.
![]() Back
Back
Page updated: 8th December 2020
Home
|
News
|
What is PLT?
|
Why the fuss?
|
What can I do?
|
Shame on you!
|
Videos
|
EMC Tests
|
EMCIA
EN55022
|
prEN50561-1:2012
|
Legislation
|
Truth & Lies
|
Adjournment Debate
Guest author DJ5IL: The Trojan Horse of the PLC-Lobby: FprEN50561-1
|
Doomed to Fail: FprEN50561-1